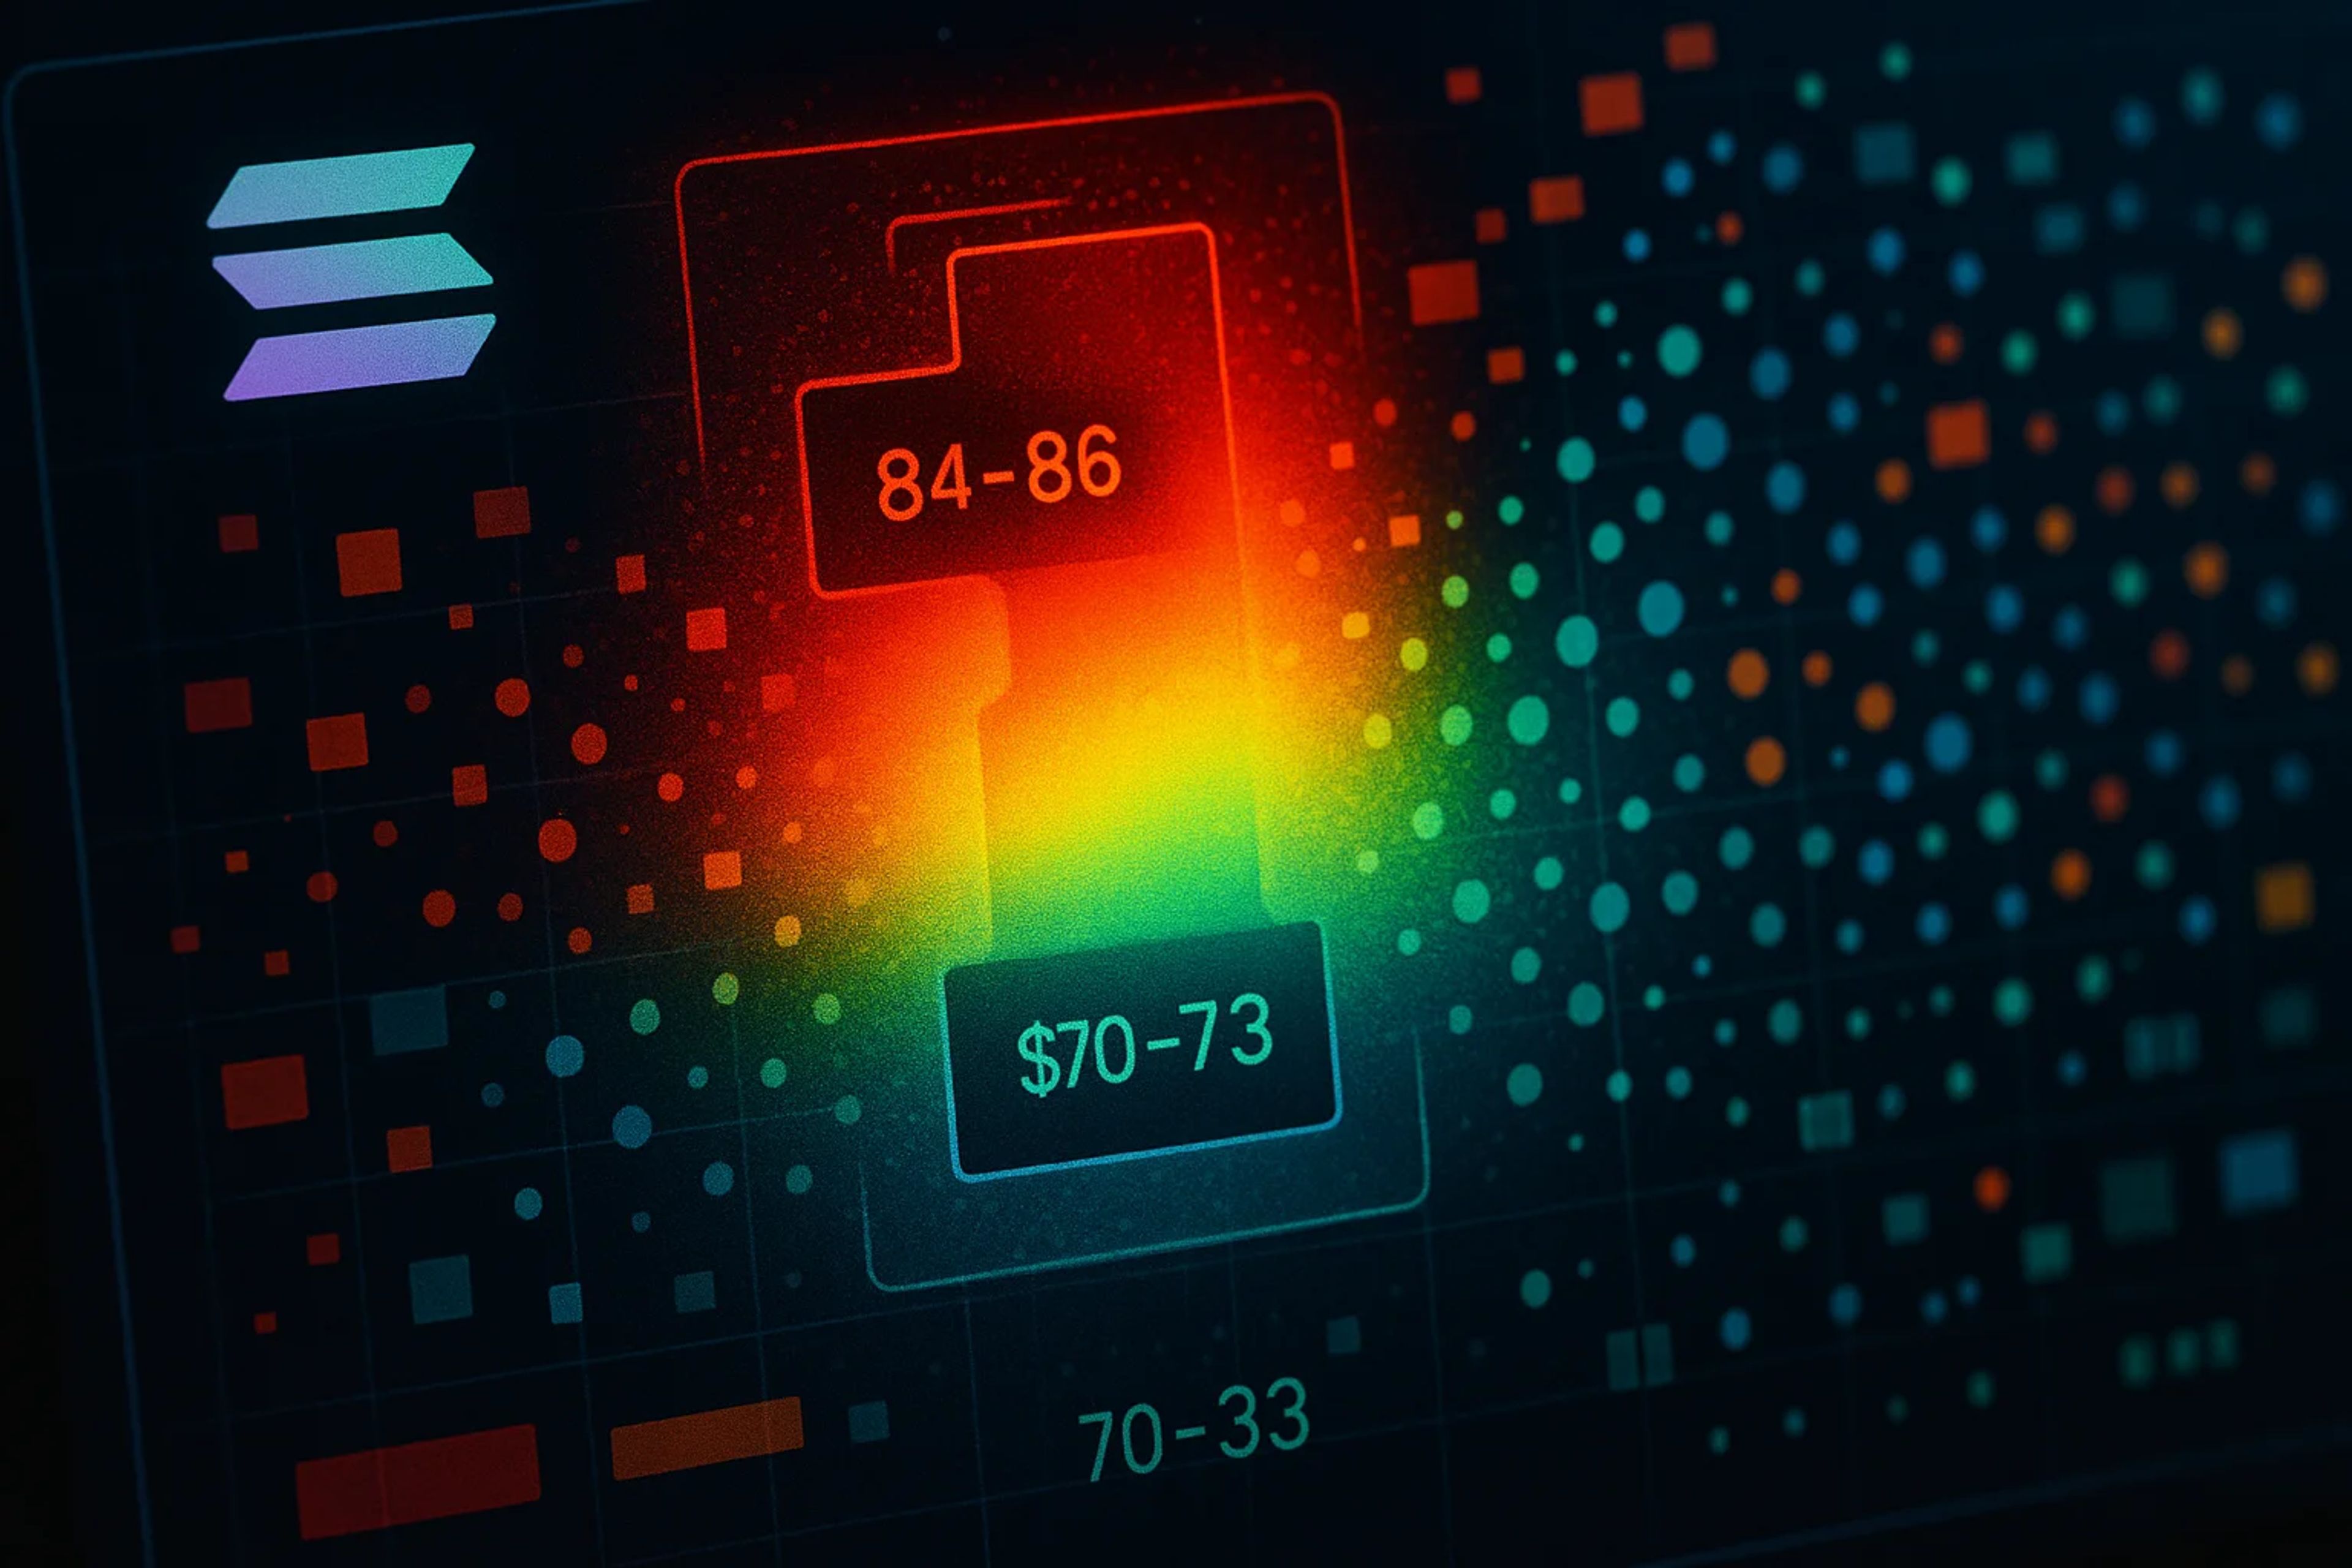
Solana heatmap flags $70-$73 downside magnet as $84-$86 turns into squeeze line
Pump.Fun’s latest $6.15M SOL sale and a 200-wallet drop in whale counts add to the pressure near $84 resistance.
Solana’s liquidation heatmap is framing a tight near-term map: $70-$73 sits as the closer downside magnet, while $84-$86 is packed with short liquidations that could fuel a squeeze if reclaimed. Flow and participation signals are leaning defensive, with continued Pump.Fun SOL distribution and fewer whale wallets since May.
Key Takeaways
- CoinGlass heatmap levels for the past month highlighted $70-$73 as the nearer downside zone, while $84-$86 showed a dense short-liquidation cluster.
- SOL failed at the $84 local resistance level and was down 4% over the past week, though it remained up 4.8% over the past month.
- Pump.Fun sold another $6.15 million worth of SOL in recent hours, taking cumulative sales to just over $800 million at an average price of $169.
- Solana whale-wallet counts fell 3.6% since May, a drop of 200 wallets, per analyst Ali Martinez.
Heatmap Levels Put $70-$73 in Focus While $84-$86 Becomes the Squeeze Line
CoinGlass’ liquidation heatmap for the past month is drawing a clean two-sided playbook for SOL: a closer downside “magnet” at $70-$73, and a concentrated short-liquidation band at $84-$86 that can turn into forced buying if price reclaims it.
That matters because liquidation clusters often act like short-term gravity wells. When price approaches a dense pocket of leverage, forced closes can accelerate the move. On the downside, the heatmap framing puts $70-$73 as the nearer zone where long liquidations could stack. On the upside, the $84-$86 area is where shorts become structurally vulnerable.
The same heatmap read also leaves room for a sweep beyond the first cluster. A push through $84-$86 was described as capable of extending into $85 and even $90, which is the part bears can’t ignore if they’re leaning into the downside target.
SOL Rejected at $84 as Weekly Momentum Softens
SOL’s recent tape fits the heatmap’s nearer downside bias. The token was rejected at the $84 local resistance level and fell 4% over the past week, even as it stayed up 4.8% over the past month.
That combination usually signals a market stuck in a range where rallies are being sold before they can flip structure. The $84 rejection also turns the $84-$86 band into a practical “line in the sand” for positioning: below it, the market is still trading under a known supply area, and the heatmap’s closer $70-$73 target remains in play.
The source also noted Morgan Stanley activated spot trading for Solana through its E*TRADE platform, but demand has not visibly improved so far. For traders, that keeps the focus on positioning and flows rather than expecting a clean demand-driven bid to appear just because access expanded.
Distribution and Participation Signals: Pump.Fun Sales and Fewer Whale Wallets
Flows are not helping the bulls’ case. Pump.Fun sold another $6.15 million worth of SOL in recent hours, bringing total sales to just over $800 million at an average token price of $169.
At the same time, large-holder participation appears to be thinning. Analyst Ali Martinez cited a 3.6% decline in Solana whale wallets since May, equal to 200 fewer whale wallets. Whale-wallet definitions vary by dataset, but directionally it points to fewer large addresses showing up as holders during a period when SOL is still struggling to reclaim the $84-$90 supply zone.
The source also pointed to rising average executed spot order size over the past six months, a metric it framed as potentially reflecting fewer trades and relatively larger “whale-sized” orders. That interpretation is not cleanly verifiable from the packet alone, and the same pattern from February to April did not translate into a sustained recovery above $100. Net, the flow picture reads more like distribution and reduced participation than a fresh accumulation wave strong enough to clear $84-$90.
Triggers Traders Are Watching Around $73 and $86
The immediate downside test is whether SOL revisits the $70-$73 heatmap zone and holds it. A clean hold would suggest liquidation-driven selling is being absorbed. A breakdown would validate the heatmap’s “imminent target” framing and keep pressure on any bounce attempts.
On the upside, the real trigger is a reclaim of $84 followed by acceptance into $84-$86. That band is where the heatmap shows a dense short-liquidation cluster, and where a squeeze dynamic can start to self-fund via forced buying toward $85 and potentially $90.
Flow updates matter in parallel. Traders will be watching for any continuation of Pump.Fun SOL sales beyond the reported additional $6.15 million and the running total of just over $800 million, alongside updates to whale-wallet counts after the reported 3.6% (200-wallet) decline since May.
How to Frame the $70 Magnet vs the $90 Squeeze Risk
I treat this setup as a positioning map first and a narrative second. The heatmap is explicit: $70-$73 is the closer downside magnet, and the failed push at $84 plus the week-over-week decline supports that near-term bearish bias.
The threshold that matters is $84-$86. If price reclaims that band, the setup starts to look structural rather than narrative-driven because shorts are forced to pay up into a known liquidation cluster, with $85-$90 as the obvious sweep zone. This only becomes practically important if SOL can either defend $70-$73 on a retest or flip $84-$86 into support, because those are the two conditions that change liquidation risk from “likely drift” into “forced move.”


